A label, more often than you'd think
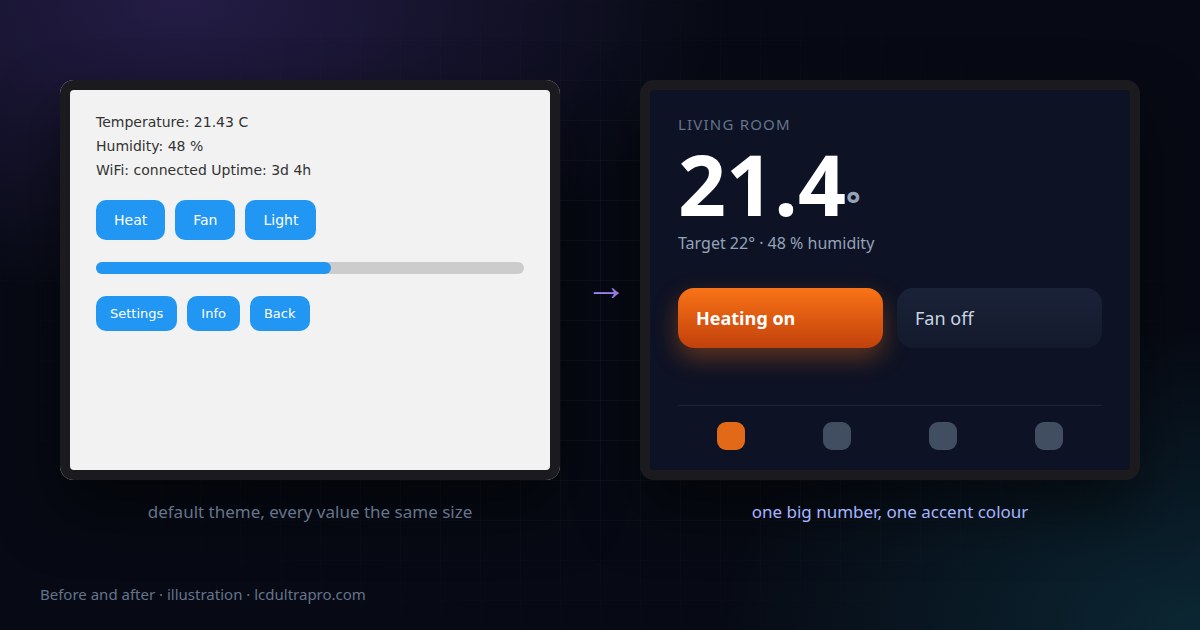
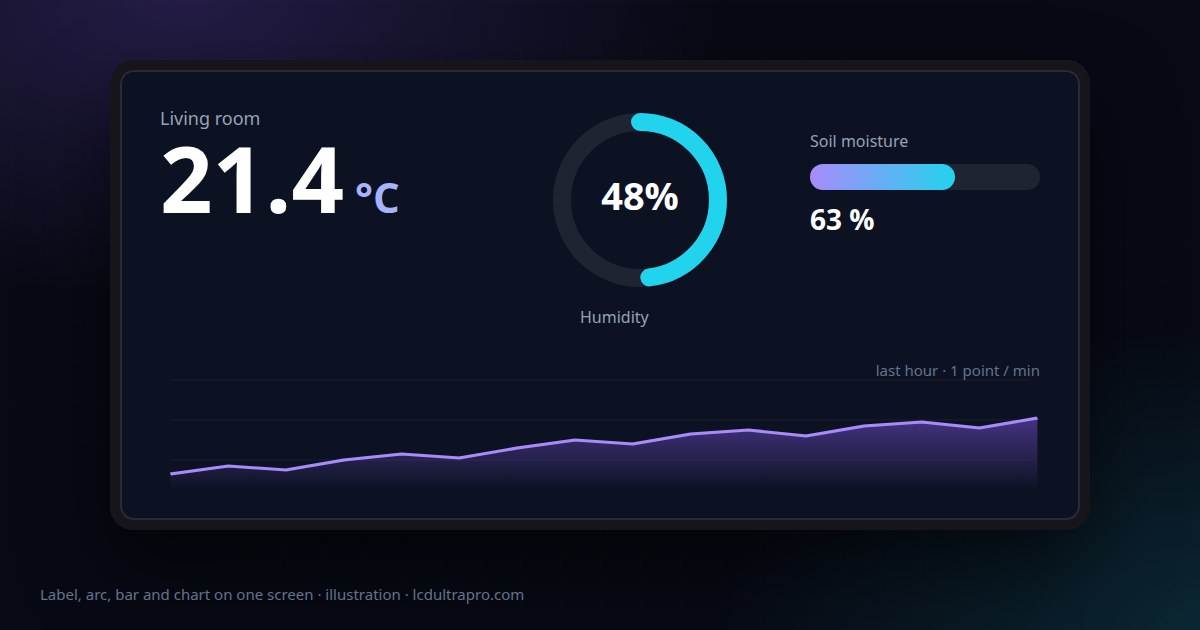
For temperature, humidity and anything else people want to read exactly, a large number beats any gauge. "21.4 °C" in a big font is understood in half a second from across the room. A needle pointing at roughly 21 isn't. On a 2.8 inch screen in particular, a well-sized label is often the best-looking option too.
Format matters more than it seems. One decimal for temperature, none for humidity, and the unit right next to it. A value jumping between 21.43 and 21.44 every second looks broken even when it isn't.
Bars and arcs for levels
Anything with a clear empty and full, like soil moisture, a water tank or a battery, reads better as a bar or an arc. Nobody needs to know the tank is at 63 percent. They need to see it's a bit over half. Set the range to match the real-world limits rather than 0 to 100, so a dry pot actually looks empty.
An arc takes more room than a bar for the same information, but it's what makes a round display look intentional. On a rectangular screen a bar usually wins.
Meters when the movement matters
A meter with a needle earns its space when the value moves and you want to see it moving: speed, power draw, signal level. It also redraws a large area on every change. On a board with an SPI display that's noticeable, so I'd keep meters for values that change a few times a second at most, and not stack four of them on one screen.
Charts for the story
A chart answers a question a number can't: is it getting warmer or colder, and since when. You decide how far back it looks with the number of points and how often you add one. Sixty points with a new one every minute shows the last hour. The same sixty points every half hour covers more than a day.
The history lives in RAM, so it starts empty after every restart. If you need it to survive a power cut, that's a job for an SD card or for sending the data to something like Home Assistant.
How often to update
Faster is not better here. Most sensors can't deliver it anyway. A DHT22 shouldn't be read more than once every two seconds, and room temperature doesn't change meaningfully in less than a minute. Updating a label every 2 to 5 seconds feels live. Updating it ten times a second just burns CPU time and makes the last digit flicker.
A good habit is to update the display and the chart at different rates: the label every few seconds, the chart every minute or so. The number feels responsive and the curve stays smooth.
Wiring it up in LCD Ultra Pro
In the editor, live values come from rules rather than code. For a typical room display it goes like this:
- 1Place the widgets: a label for temperature, an arc or bar for humidity, a chart below.
- 2Add a rule that runs every 5000 ms. Give it a Set text action on the label, pick the BME280 temperature as the dynamic value, and use a format like
%.1f °C. - 3In the same rule, add a Set value action for the arc with the humidity reading.
- 4Add a second rule that runs every 60000 ms with an Add a point to a chart action, and set the chart's number of points for the time span you want.
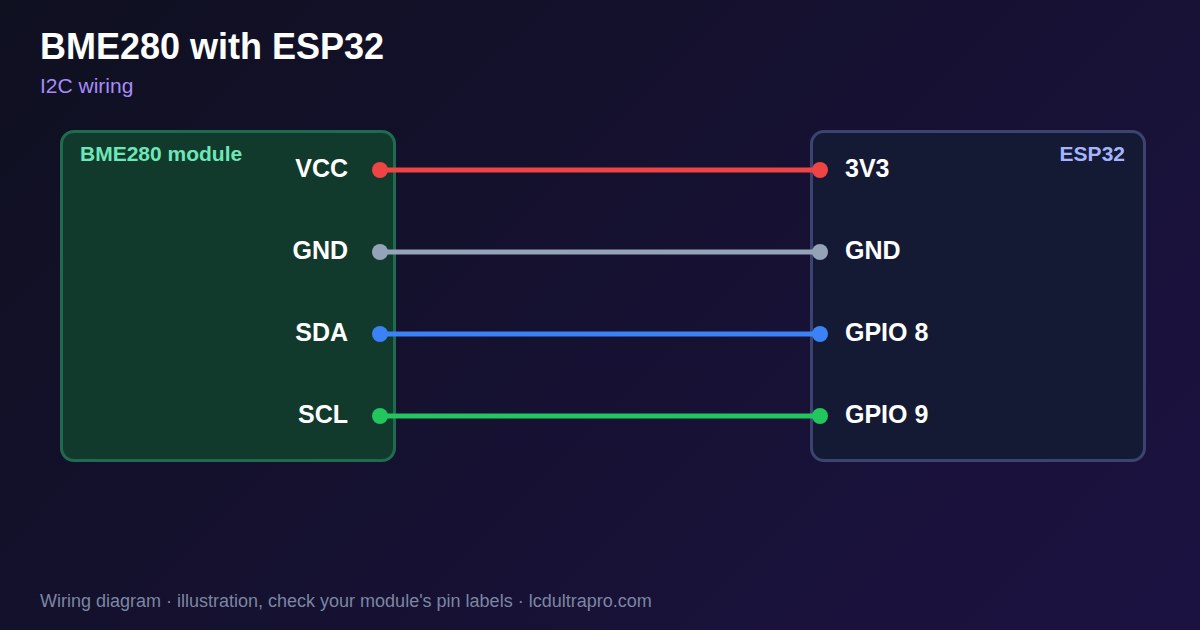
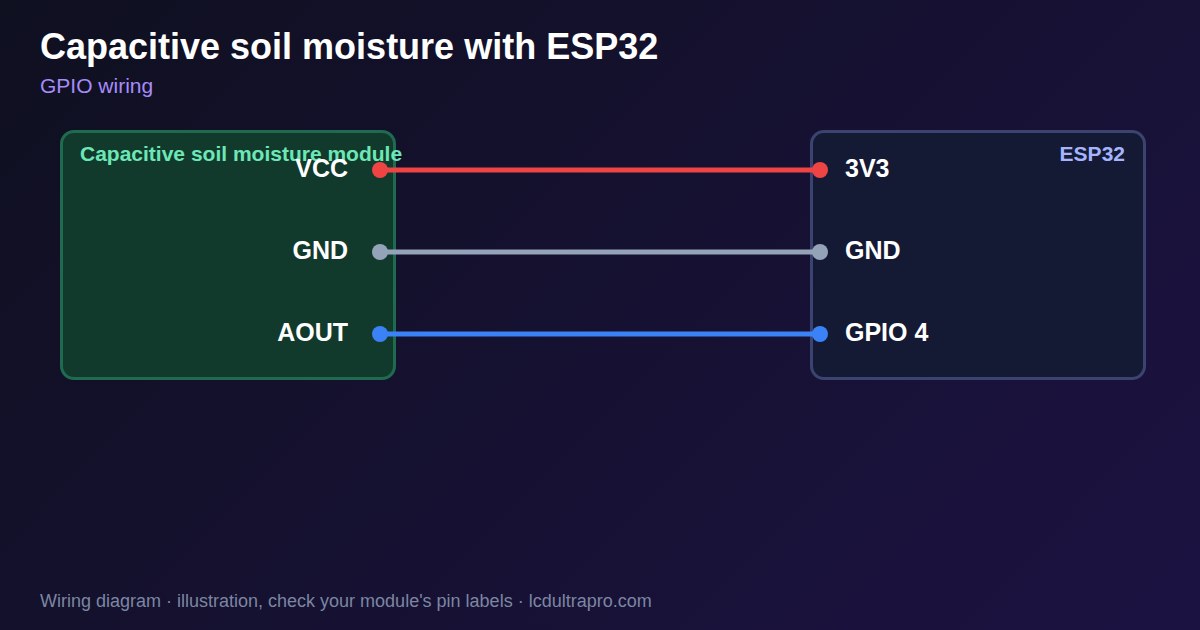
Analog sensors work the same way. The value can be an expression on the raw reading, so a soil probe's numbers can be turned into a percentage between your own dry and wet values right in the rule. Values arriving over MQTT can feed the same actions, and there's a ready-made MQTT chart component that shows a topic's history with the latest value on top.
One extra that's easy to miss: the display brightness can come from a value too. Feed it a light sensor reading and the screen dims itself at night.
If you only take one thing from this, make the most important number the biggest thing on the screen. Everything else is decoration around it.
- #lvgl
- #esp32 display
- #sensor dashboard
- #lvgl chart
- #lvgl meter
- #live data